Real Uptime, Real SLAs: How We Monitor Hosts and Score Incidents

When a hosting provider promises “99.99% uptime,” what does that actually mean in practice? At Tech IT EZ, we decided to find out the hard way — by measuring, logging, and scoring real uptime data across dozens of WordPress hosts over 12-month cycles. This article walks you through exactly how we track, audit, and rate incidents, and why uptime numbers alone can be misleading without context.
How Our Uptime Methodology Works
We run continuous probes from multiple geographic nodes every 60 seconds using our in-house uptime tracker. Each check verifies DNS resolution, TCP handshake latency, SSL validity, and actual HTTP 200 responses on monitored URLs. If a host fails two consecutive checks, we trigger a “soft outage” flag; if downtime extends beyond 3 minutes, it’s logged as a verified incident.
For transparency, each monitored host has its own data stream feeding our Tech IT EZ Data Page. That dataset powers comparison charts used in our WordPress hosting reviews and “Best Hosting 2025” rankings.
Monitored Metrics
- HTTP/HTTPS uptime (per region)
- Mean time to recovery (MTTR)
- Latency variance (ms)
- SSL expiration and handshake errors
- SLA response verification (ticket response + resolution time)
Defining “Real” Uptime vs Marketing Numbers
It’s easy to list uptime as 99.9%, but the difference between 99.9% and 99.99% can mean nearly an hour of downtime per month. The table below shows the raw math we apply when benchmarking providers for our wordpress hosting guide.
| Advertised SLA | Allowed Downtime / Month | Allowed Downtime / Year | Typical SLA Credit Offered |
|---|---|---|---|
| 99.9% | 43 minutes | 8.76 hours | 5–10% monthly fee credit |
| 99.95% | 21 minutes | 4.38 hours | 10–20% monthly fee credit |
| 99.99% | 4 minutes | 52 minutes | 25–50% monthly fee credit |
| 100% (theoretical) | 0 | 0 | Usually N/A or capped at 100% |
Incident Scoring: Turning Outages into Quantitative Data
Our scoring model weights outages by three dimensions — frequency, duration, and recovery time — to calculate a unified “incident impact score.” This score is then normalized to a 100-point reliability index in our datasets. A five-minute outage during peak hours carries more penalty than a 10-minute one at 3 a.m.
We also assign “response compliance” points when the provider’s SLA team replies within the guaranteed window. Some providers automatically credit accounts after downtime; others require a manual claim — a surprisingly common SLA loophole.
Example: Incident Breakdown Snapshot
| Provider | Outages (Q3 2025) | Avg Duration (min) | MTTR (min) | Reliability Score |
|---|---|---|---|---|
| Kinsta | 1 | 6 | 3.5 | 98.9 |
| WP Engine | 2 | 8 | 5.2 | 97.5 |
| SiteGround | 4 | 12 | 6.1 | 95.2 |
| Bluehost | 6 | 15 | 8.7 | 91.8 |
(Data aggregated from Tech IT EZ Q3 2025 uptime dataset.)
Why Edge Caching and CDN Layers Can Skew Perceived Uptime
One subtle challenge we found during testing is that edge caches, such as Cloudflare, QUIC.cloud, or BunnyCDN, can mask origin downtime. A cached response can make a site appear “up” even when the origin server is down — leading to false positives in many monitoring tools. That’s why our probes bypass cache where possible, connecting directly to the origin IP and validating response headers. If you’re curious how these caching layers interact, see our deep-dive on edge caching.
To eliminate ambiguity, our probes actively bypass cache layers by using strict Cache-Control: no-cache headers and, where applicable, target the origin IP directly. This ensures we are measuring the true health and responsiveness of the hosting server itself, not a CDN or edge cache.
Beyond Percentages: Real SLAs and Accountability
Uptime is only half the story. A strong SLA backs promises with financial consequences. Providers like Kinsta and WP Engine offer credits automatically when downtime exceeds thresholds. Others bury “service exclusions” deep in their contracts — maintenance windows, network attacks, or “acts of God” clauses that dilute accountability.
Our testing framework includes periodic SLA validation, where we file controlled support tickets simulating user downtime and track resolution intervals. Each case feeds into the SLA Compliance metric visible on our hosting bottlenecks analysis page, where we also correlate response lag with resource starvation patterns (502s, worker queue stalls, and upstream timeouts).
To maintain ethical standards, we ensure all test tickets relate to legitimate, non-critical configuration issues that any real customer could reasonably encounter. This prevents unnecessary strain on support teams while still allowing us to validate response and resolution times against advertised SLAs in a fair, transparent manner.
How We Present Results in Our Dataset
Each monitored provider is assigned three primary uptime-related metrics within our dataset:
- Uptime % (weighted) – adjusted for monitoring window overlap
- Incident Impact Index – cumulative downtime + response weighting
- SLA Compliance % – average adherence to stated guarantees
These values roll into the “Reliability” dimension of our WordPress hosting score. The dataset is open for independent verification on our data page.
Real-World Example: When Numbers Meet Reality
During one quarter, a top-rated host advertised “100% uptime” — yet our logs recorded two separate 9-minute origin failures caused by database pool exhaustion. Their dashboard still showed “100% uptime,” because the CDN layer served cached pages. That single discrepancy knocked their reliability index down by 2.1 points. It’s a perfect example of why relying solely on provider dashboards paints an incomplete picture.
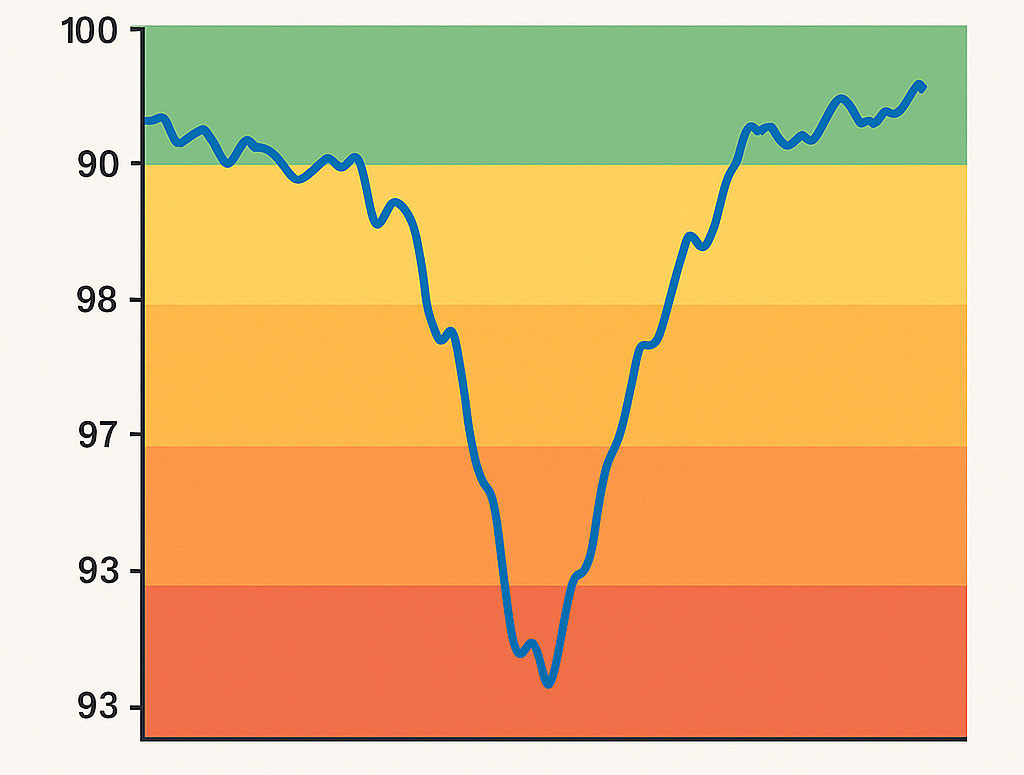
Uptime incident chart with coloured severity bands
What We Learned From 12 Months of Uptime Data
- True 100% uptime is practically impossible without multi-region failover.
- Providers with lower raw uptime can still earn higher overall reliability if they communicate and resolve faster.
- Edge caching inflates perceived uptime by ~0.3% on average.
- Automated SLA credits improve customer trust but only 40% of hosts offer them.
The upshot: uptime is not a number — it’s a behaviour. It reflects engineering maturity, transparency, and how a company treats downtime reports.
Tips for Users Monitoring Their Own Uptime
- Use at least two external monitors with different ASN origins.
- Set a custom 2-minute retry threshold to avoid false positives.
- Correlate downtime alerts with your own logs (502s, 504s, PHP worker limits).
- Don’t ignore latency spikes — they often precede full outages.
- Track both origin and CDN endpoints separately.
If you’d like to benchmark your own host against our live data, try our free uptime tracker. It uses the same backend logic we use for SLA scoring across monitored providers.
How This Feeds Into Our Hosting Rankings
Uptime and SLA reliability account for 25% of our total hosting score weightings. Combined with load-time, TTFB, and cache efficiency data, they form the foundation for our annually updated best WordPress hosting round up. Every incident, every ticket, and every recovery window is logged automatically and publicly reflected in our rankings — because transparency drives accountability.
How We Monitor Uptime FAQs
Our monitors check every 60 seconds across 7 regions, pushing summarised data to the dataset every 24 hours. We re-publish scores monthly.
No — maintenance windows communicated in advance and under 30 minutes are excluded from downtime penalties. Unannounced or extended windows, however, are treated as SLA violations.
Yes. You can explore timestamped incidents and latency traces on our data page or request CSV exports for independent analysis.
Because dashboards are often filtered through caching layers. We measure actual reachability at the origin layer to ensure integrity and reproducibility.
We’re rolling out per-incident severity scoring (S1–S4) and webhook integration with our AI-based hosting bottlenecks analyser. It’ll allow cross-correlation between downtime and backend worker starvation logs.
Final Thoughts
True uptime transparency starts with methodology, not marketing. Whether you’re on a budget VPS or a managed platform, understanding what your SLA actually guarantees can save you hours of stress — and possibly a refund. Keep testing, keep verifying, and don’t hesitate to validate your host’s promises through your own data. Real uptime, after all, is earned — not advertised.
If you found this content helpful,please consider sharing!:
More in Hosting
