
What Is LCP (Largest Contentful Paint)? Beginner’s Guide

LCP, or Largest Contentful Paint, is one of Google’s Core Web Vitals and a key way of measuring how quickly the main content of a page appears on screen. In simple terms, LCP answers the question: how long does it take until the largest, most important thing on the page is visible and readable?
In this beginner’s guide, we will walk through what LCP is, why it matters for SEO and user experience, how browsers calculate it, which elements count towards LCP, common causes of slow LCP, and a practical optimisation checklist you can follow. We will also look at how hosting, caching and WordPress themes affect LCP, and how to measure it using both lab and real user data.
I have spent more than a decade working on high-traffic WordPress and SaaS sites, tuning Core Web Vitals, building custom performance dashboards, and experimenting with different caching layers and CDNs. The explanations and checklists below come from real-world debugging sessions, not just theory.
If you want to see how a complete hosting speed stack for Core Web Vitals fits together in practice, you can explore that guide once you are comfortable with the basics of LCP covered here. And if you are comparing providers, our breakdown of the top hosting companies can help you choose an infrastructure that will not hold your Core Web Vitals back.
To get a benchmark on how your site is performing for LCP and other metrics, check out our speed score tool.
What is LCP (Largest Contentful Paint)?
LCP is a performance metric that measures how long it takes for the largest content element in the visible part of the page (the viewport) to become fully rendered. It is part of Google’s Core Web Vitals alongside FID (First Input Delay, now replaced in practice by INP) and CLS (Cumulative Layout Shift).
Think of LCP as the moment where a typical user would say, “OK, the page is basically here.” It ignores tiny elements like icons or nav links and focuses on the biggest, most meaningful piece of content above the fold.
For most sites, the LCP element is one of the following:
- A large hero image or banner
- A big featured image at the top of a blog post or product page
- A large block of text, such as an H1 plus an introductory paragraph
- A video poster image (before the video plays)
Google defines recommended LCP thresholds as:
- Good: LCP occurs within 2.5 seconds of the user starting to load the page
- Needs improvement: Between 2.5 and 4.0 seconds
- Poor: Longer than 4.0 seconds
These thresholds are evaluated using real user data, not just synthetic lab tests. That means your visitors’ devices, connections, locations and network conditions all influence your LCP performance.
Why LCP matters for SEO, UX and conversions
LCP sits at the intersection of user experience and search visibility. It matters for three main reasons:
Search rankings
Core Web Vitals are part of Google’s page experience signals. They are not the only ranking factor, but they are one of the few that you can measure and systematically improve. If two pages are similar in relevance and content quality, the one with better LCP and overall Core Web Vitals often has an edge.
User satisfaction
Users do not think in terms of “Largest Contentful Paint”. They think in terms of “this site feels slow” or “that product page snapped open quickly”. LCP is strongly correlated with perceived load speed because it lines up with the moment the page looks useable.
Studies from Google’s Web Dev team have shown that faster LCP scores correlate with higher engagement and lower bounce rates. When users can see the primary content sooner, they are more likely to scroll, click and interact.
Revenue and conversions
If you run an ecommerce site or SaaS product, slow LCP is effectively a tax on your revenue. The longer your hero section or key product content takes to appear, the more users abandon the page and the fewer reach your call-to-action. Even small percentage improvements in conversion rate can translate into meaningful revenue over a year.
From experience, performance work on LCP often pays for itself: optimising above-the-fold content, improving image delivery and tightening up your hosting stack usually benefits every visitor, not just a niche segment.
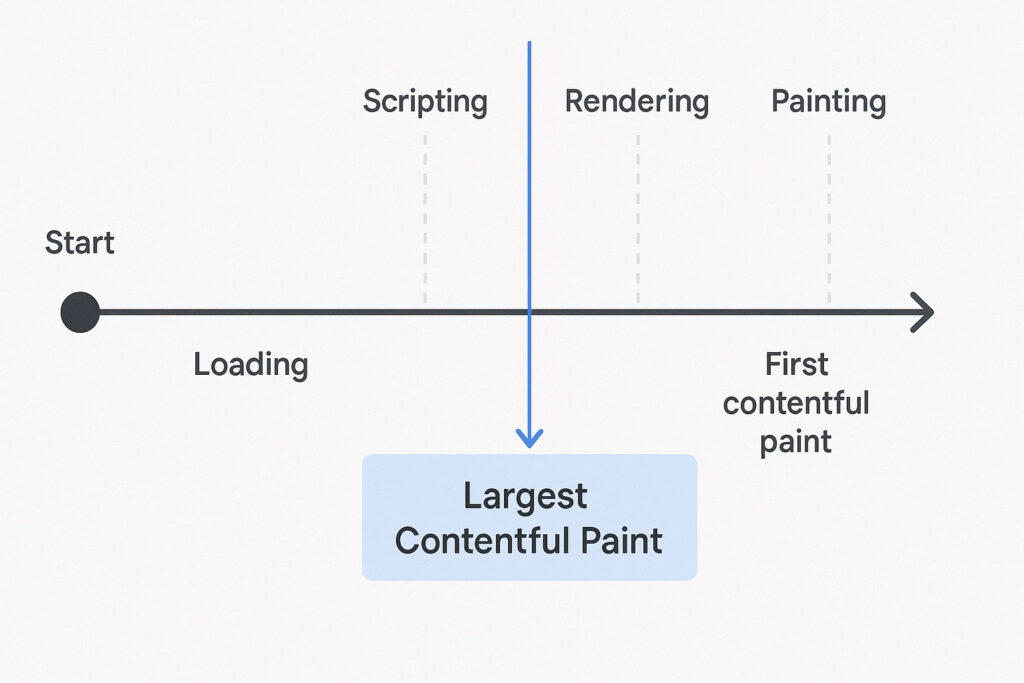
How browsers calculate LCP step by step
To optimise LCP effectively, it helps to understand how browsers actually calculate it. Under the hood, there is a little more going on than “load the largest thing and stop the timer”.
The process is roughly:
- The user navigates to a page and the browser starts fetching the HTML.
- The browser parses the HTML and builds the DOM (Document Object Model).
- As it encounters external resources like CSS and JavaScript, it may block rendering to wait for them.
- The browser builds the render tree and starts painting content to the screen.
- Each time a candidate “large content element” is rendered or changes size, the browser records a potential LCP timestamp.
- The Largest Contentful Paint is the time when the largest candidate element is rendered for the last time.
Candidate elements for LCP include:
<img>elements<image>elements inside SVG- Block-level text elements, such as
<p>,<h1>or<h2>, if they are large enough - Background images loaded via
url()in CSS on block-level elements - Poster images for
<video>elements
Importantly, LCP is measured relative to the first time the page started loading, not after DOMContentLoaded or onload. That means anything that slows down the browser’s ability to render above-the-fold content – from slow DNS resolution through to render-blocking CSS and third-party scripts – can impact LCP.
Which elements count towards LCP (and which do not)
One of the most common misunderstandings is that LCP will always be a big image. That is often true, but not guaranteed. The actual LCP element is the largest content element within the initial viewport at the moment it is rendered.
Elements that can be LCP
- Hero banner images at the top of the page
- Featured images for blog posts or news articles
- Product images on ecommerce landing pages
- Large text blocks, such as a big headline and intro paragraph
- Video poster images
- Elements with CSS background images, if they cover a large area
Elements that are not considered for LCP
- Inline SVG shapes (unless they use
<image>) - Small icons or logos
- Images that are initially off-screen (e.g. below the fold)
- Elements inserted after the user interacts (e.g. modals opened on click)
It is also possible for the LCP element to change during the page lifecycle. For instance, a large heading may initially be the biggest element, but once the hero image finishes loading and paints fully, that image becomes the LCP candidate. The browser will update the LCP timestamp accordingly.
Good LCP vs poor LCP: thresholds and examples
Although the thresholds for good, needs improvement and poor LCP are fixed, how they translate to real-world pages can vary. Here is a simple summary:
| LCP score band | Time to LCP (seconds) | User perception |
|---|---|---|
| Good | 0.0 – 2.5 | Page feels snappy, content appears quickly and is readable almost immediately. |
| Needs improvement | 2.5 – 4.0 | Noticeable pause before main content appears. Users may feel the site is “okay but not fast”. |
| Poor | 4.0+ | Long wait before anything useful appears. High risk of abandonment. |
In practice:
- A simple blog on good hosting with optimised images can often hit LCP in around 1.0 – 1.5 seconds for most users.
- A more complex ecommerce homepage with carousels, large hero images and third-party scripts might flirt with the 2.5 – 3.5 second range.
- Sites with unoptimised hero videos, huge images and weak hosting frequently end up above 4 seconds, particularly on mobile.
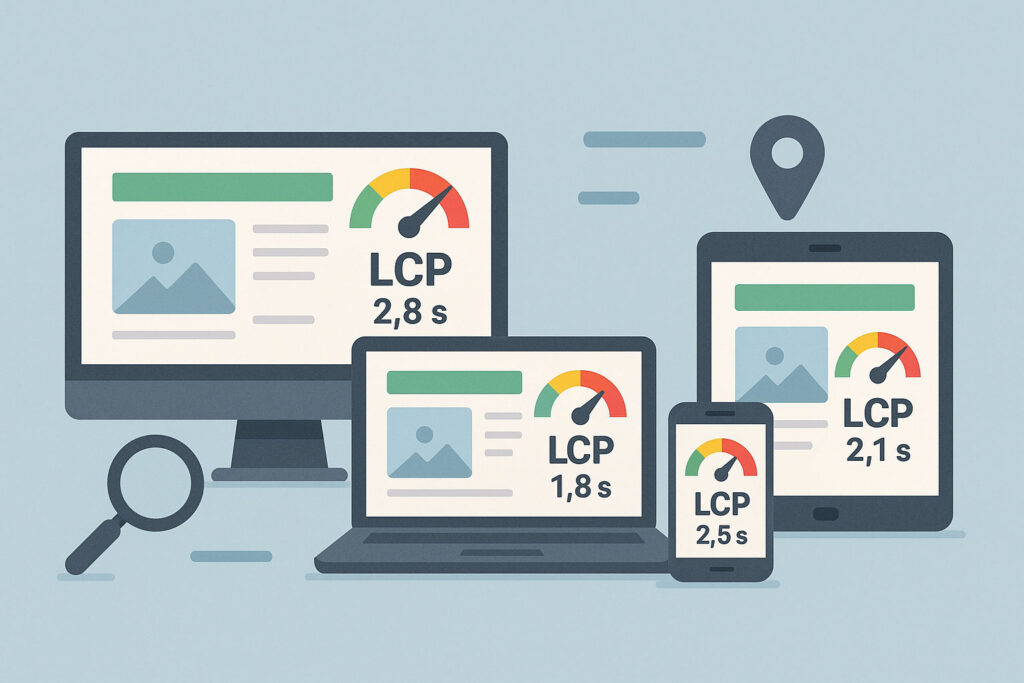
Speed also needs to be consistent. A page that loads in 1.5 seconds for desktop on fibre broadband but 5 seconds for mobile users on a congested 4G network will still score poorly in field data, because Core Web Vitals are evaluated across the whole user population.
Common causes of poor LCP
Poor LCP almost always comes down to the same families of issues. Diagnosing them is a matter of mapping your symptoms to the most likely root causes.
Slow server response and high TTFB
If your server takes a long time to respond with the initial HTML, everything else is delayed. High TTFB (Time To First Byte) is often due to:
- Overloaded or underpowered hosting
- Lack of full-page caching for anonymous traffic
- Heavy backend logic on each request, such as slow database queries
- Geographical distance between user and origin server
Unoptimised hero images
Because the LCP element is often a hero image, poor image hygiene is a classic culprit:
- Huge file sizes (multi-megabyte JPEGs or PNGs)
- No modern formats like WebP or AVIF
- Images not resized for the actual display dimensions
- Images loaded synchronously without priority hints or preloads
Render-blocking CSS and JavaScript
CSS must be downloaded and parsed before the browser can safely render content. If you have several large CSS files blocking rendering in the head, your LCP will slip. Heavy JavaScript that executes early can also delay rendering or cause the browser to “jank” right around the time the LCP element should appear.
Client-heavy frameworks
Single-page applications or sites that rely heavily on client-side rendering can suffer from slow LCP simply because nothing meaningful is rendered until the JavaScript bundles are downloaded and executed. If your largest above-the-fold content only appears after a React or Vue app hydrates, your LCP may be significantly worse on low-end devices.
Third-party scripts and tags
Tag managers, analytics scripts, chat widgets and A/B testing tools can all add latency. Poorly configured third-party scripts that run on the critical path may hog the main thread just when the browser is trying to render the LCP element.
How to measure LCP (lab and field data)
To work on LCP systematically, you need both controlled lab tests and real user data. Lab data helps you experiment quickly, while field data tells you how the site behaves in the wild.
Lab tools
- Lighthouse (in Chrome DevTools): Allows you to run performance audits on local pages or staging environments, giving you LCP along with detailed diagnostics.
- WebPageTest: A more advanced tool that lets you test from different locations, devices and connection speeds, with filmstrips of rendering.
- Chrome’s Performance panel: Useful when you need to dive deep into what is blocking rendering or causing main-thread jank around LCP.
Field data
- Chrome User Experience Report (CrUX): Aggregated data from real Chrome users, exposed via tools like PageSpeed Insights.
- Google Search Console (Core Web Vitals report): Shows how real users experience your pages, grouped by URL patterns.
- RUM (Real User Monitoring) tools: Custom or third-party scripts that measure LCP directly in your visitors’ browsers.
| Tool | Data type | Best use case |
|---|---|---|
| Lighthouse | Lab | Debugging specific pages and testing small changes. |
| WebPageTest | Lab | Analysing complex sites across locations and devices. |
| PageSpeed Insights | Lab + Field | Getting a quick overview plus real user LCP data. |
| Search Console | Field | Monitoring site-wide LCP trends over time. |
| RUM solutions | Field | Fine-grained per-user and per-segment LCP analysis. |
How hosting affects LCP
Your hosting platform forms the base of your performance stack. Even the best front-end optimisation will struggle to deliver a good LCP if your server or network is slow.
Key hosting factors that impact LCP
- Server hardware and resource limits: CPU, RAM and the number of PHP workers determine how quickly your application can generate pages.
- Geographic location: The closer your users are to your origin or CDN edge, the lower your network latency and TTFB.
- Caching strategy: Full-page caching and edge caching ensure that HTML is served from memory or edge nodes rather than generated on every request.
- HTTP/2 and HTTP/3 support: Modern protocols allow more efficient multiplexing of assets, helping your LCP resources arrive faster.
- Configuration of web server: NGINX, LiteSpeed and tuned Apache setups can all deliver excellent LCP if configured properly.
In practice, moving from oversold shared hosting to a well-tuned managed solution with proper full-page caching often cuts LCP times dramatically, sometimes by more than a second for mobile users.
If you want to see how hosting, caching and CDN layers can be arranged to support strong Core Web Vitals, our WordPress hosting speed stack for Core Web Vitals article walks through a full-stack example.
| Hosting characteristic | Typical impact on LCP | Impact rating |
|---|---|---|
| High TTFB due to slow PHP/database | Delays initial HTML, pushing LCP later. | ★★★★★ |
| No full-page caching | Every request is regenerated, causing inconsistent and slow LCP. | ★★★★★ |
| No CDN or poor CDN config | Higher latency for users far from the origin. | ★★★★☆ |
| Limited CPU/RAM on shared hosting | Performance degrades at peak traffic, LCP spikes. | ★★★★☆ |
| Modern HTTP/3-enabled stack | More efficient delivery of LCP resources. | ★★★☆☆ |
When you evaluate infrastructure, do not just compare price and storage. Look for evidence that a provider genuinely optimises for Core Web Vitals. Our independent analysis of the best rated hosting companies focuses on exactly these performance characteristics.
Optimisation checklist: how to improve LCP step by step
This is the practical checklist you can follow when you want to make a measurable improvement to your LCP scores. Work through each step and re-test after major changes.
- Identify the LCP element on key templates
- Use PageSpeed Insights or Lighthouse to find the actual element being reported as LCP.
- Check for mobile and desktop separately; they may differ.
- Optimise the LCP resource itself
- Convert large images to WebP or AVIF.
- Resize images to match the display size on typical viewports.
- Remove unnecessary overlays or heavy filters applied on the server.
- Serve the LCP resource efficiently
- Use
preloadfor critical hero images or above-the-fold fonts. - Use the
fetchpriorityattribute to mark the LCP image as high priority where supported. - Ensure HTTP/2 or HTTP/3 is enabled between your origin/CDN and visitors.
- Use
- Reduce server response time (TTFB)
- Enable full-page caching for anonymous visitors.
- Move heavy background work (like cron jobs) off the main request path.
- Upgrade CPU/RAM or move to a better hosting tier if you are consistently CPU-bound.
- Eliminate render-blocking CSS and JS
- Inline a small critical CSS block for above-the-fold layout.
- Defer non-essential scripts and load them after the initial render.
- Audit third-party tags and remove anything not absolutely necessary.
- Use a CDN correctly
- Serve images, CSS and JS from a CDN close to your users.
- Use smart caching rules so HTML and static assets are cached at the edge where safe.
- Enable image optimisation features where they do not conflict with your own tooling.
- Optimise for mobile first
- Test LCP on mid-range Android devices over throttled 4G in lab tools.
- Ensure the mobile viewport does not show an unnecessarily huge hero image or auto-playing video.
- Keep above-the-fold layouts simple and fast.
- Monitor field data over time
- Use Search Console’s Core Web Vitals report to track LCP groupings.
- Implement a basic RUM script to collect LCP samples from real users if you need more granularity.
- Revisit this checklist as you roll out design or plugin changes.
LCP for WordPress specifically: real-world patterns
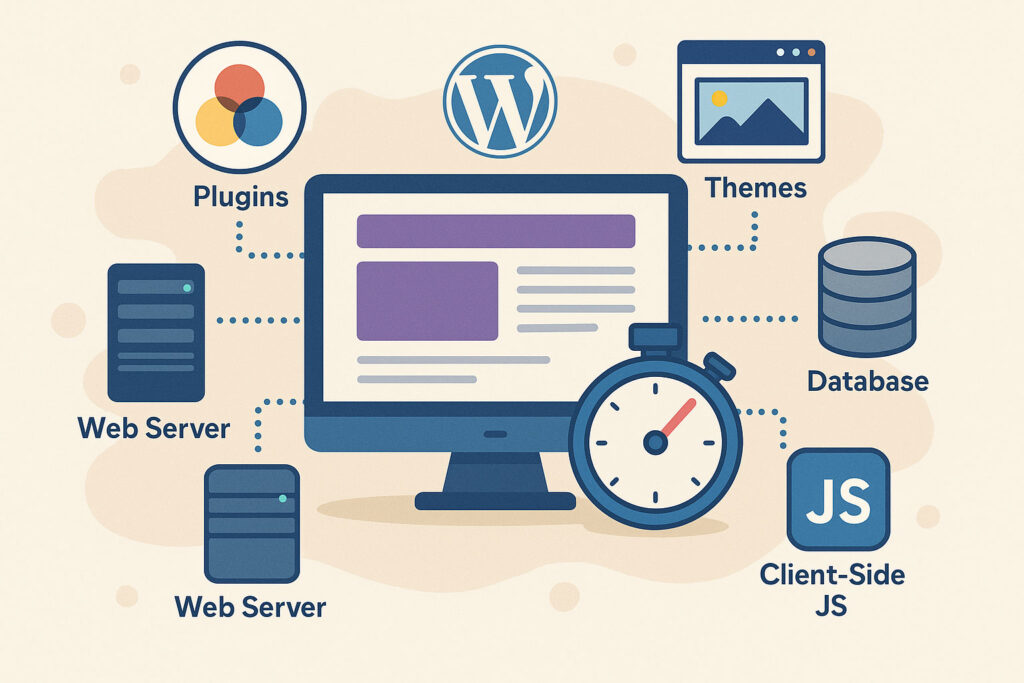
On WordPress sites, certain patterns show up again and again when we troubleshoot poor LCP. The good news is that many of them are fixable without rewriting your entire theme.
Bloated themes and page builders
Some multipurpose themes and heavy page builders ship with large CSS bundles, many JavaScript dependencies and complex layouts. Above-the-fold sections built with nested containers, sliders and animations tend to increase LCP.
Where possible:
- Use lightweight themes that focus on performance.
- Limit page builder usage above the fold; static markup is often faster.
- Disable modules and widgets you are not using.
Unoptimised plugins
It only takes a few poorly coded plugins to undo good hosting and caching. Plugins that inject scripts, add widgets to the header or modify queries on every request can hurt TTFB and LCP.
- Audit plugins regularly and remove anything you no longer need.
- Profile slow queries using tools like Query Monitor.
- Replace heavy plugins with leaner alternatives where possible.
Misconfigured caching and CDNs
WordPress performance stacks often include multiple layers of caching: plugin-based full-page cache, server-level cache and CDN edge cache. If these are misconfigured, you can end up in a situation where HTML is not cached effectively, or where logged-out users are not actually receiving cached pages.
- Confirm that your primary cache is serving HITs for anonymous users.
- Ensure your CDN is not bypassing cache due to cookies or query strings you do not need.
- Test logged-out behaviour in incognito windows and from different locations.
Common misconfigurations and pitfalls that secretly hurt LCP
Beyond the obvious issues, there are some subtle misconfigurations that repeatedly show up in LCP audits.
Lazy-loading the LCP image
Lazy loading is generally good practice for below-the-fold images, but if you add loading="lazy" to the hero image that is actually your LCP element, you introduce an avoidable delay. Make sure your above-the-fold hero image is exempt from lazy loading.
Excessive font variants
Custom web fonts can easily become a bottleneck. Multiple weights, italic variants and separate font files for every style increase the number of requests and total bytes. If text is your LCP element, slow font loading can delay its rendering.
Limit yourself to a small number of font families and weights, and ensure font files are compressed and cached properly. Consider using font-display strategies that avoid invisible text during load.
Animation-heavy hero sections
Animated hero banners, sliders and parallax effects may look impressive in a design tool, but they cost you in LCP. The more work the browser has to do to lay out and paint the hero section, the more likely it is that users will wait longer to see anything useful.
Underestimating mobile network variability
Lab tests on a fast desktop connection can mask performance issues that appear on real mobile devices. A hero image that loads “instantly” on fibre can easily push LCP beyond 3 seconds on congested mobile networks. Always validate performance on realistic mobile conditions.
Putting it all together: LCP as part of a holistic performance strategy
LCP is one metric in a wider performance picture, but it is a powerful one: improving LCP usually forces you to tackle the true bottlenecks in your stack. The most effective optimisation efforts tend to combine:
- Solid, performance-focused hosting that treats Core Web Vitals as first-class concerns.
- A lean front-end with optimised images, minimal blocking assets and simple above-the-fold layouts.
- Smart caching and CDN usage so users receive content from nearby, warm caches.
- Continuous measurement using both lab tests and real user monitoring.
Once you understand what LCP measures and how it is calculated, you can use it as a guiding metric when making design, plugin and infrastructure decisions. If a proposed change makes LCP significantly worse for mobile users, it is often a signal that the change needs to be rethought.
Once you have your LCP in check using the information in this guide, check out this helpful saas technical seo guide where you can get a free site audit to futher optimise your pages.
Learn what LCP FAQs
Yes. Tools like PageSpeed Insights and Search Console report LCP separately for mobile and desktop. Mobile scores are often worse because of slower devices and higher network latency, so always pay attention to the mobile data.
For most sites, a monthly review of Core Web Vitals in Search Console is a good baseline. If you are actively rolling out performance changes or major design updates, check more frequently and use lab tools to validate changes before deploying to production.
Absolutely. If your above-the-fold layout is mostly text, the largest block of text – often your heading plus introductory paragraph – can be the LCP element. Font loading and render-blocking CSS become particularly important in that scenario.
Not automatically, but many LCP optimisations also benefit other metrics. For example, better caching reduces TTFB, while reducing render-blocking scripts can help both LCP and interaction metrics such as INP. Always check the full Core Web Vitals picture to avoid regressions.
Ideally, you want at least 75% of real user visits to a given page group to have an LCP of 2.5 seconds or less. That threshold is how Google evaluates “good” LCP in the field. In lab tests, aim for comfortably under that to give yourself headroom for real-world variability.
By understanding LCP and following the optimisation checklist above, you will be well on your way to building sites that feel fast, rank better and convert more visitors into customers.
Note: Whenever you revisit your hosting or front-end stack, keep Core Web Vitals in mind from the start rather than as an afterthought. It is far easier to design for good LCP from day one than to retrofit performance into an already bloated build.
If you found this content helpful,please consider sharing!:
More in Hosting
